Have you ever wondered why your meticulously created tweet didn’t take off, while the neighboring post with a kitten gathered thousands of likes and retweets? If so, you’re not alone! Many think that success on Twitter is just a lottery. And all who are sure of this are mistaken. The situation can and should be taken under control!
In this article, we won’t just talk about what Twitter Analytics is, but we’ll also figure out why it’s needed and how to use it to squeeze the most out of your content. We’ll get into analyzing, optimizing, and, of course, enhancing your content so that, finally, everyone’s smashing that “retweet” button.
What is Twitter Analytics?
Twitter Analytics is a built-in service on Twitter (X) that shows stats about your account and tweets. You’re peeking under the hood of your social media machine to see what’s ticking: how many people saw your tweet, liked it, retweeted it, clicked on a link, and more.
You get access to information about your followers: age, gender, interests, and location. You can see how people interact with your content. So, you understand what topics and formats are most engaging for them. If you’re posting videos, you’ll receive reports on views, showing how long people watch your videos and when they typically drop off or close them.
How to Access X (Twitter) Analytics
Getting to X (Twitter) Analytics is super easy:
- Log into your Twitter account. Yep, it all starts with logging in;
- Go to the analytics page. In your browser’s address bar, type analytics.twitter.com or just click on your avatar, choose “Professional Tools,” then “Analytics”;
- Start exploring your data. If it’s your first time there, you might see a “Get Started” or “Turn Analytics On” button. Go ahead and click it (the whole process is quick and easy).
Differences Between Standard and Advanced Twitter Analytics
Talking about the differences between standard and advanced twitter analytics, the main thing is how much information you can get and how you can use it.
So, basic analytics is what everyone gets for free. It’s your straightforward stats. You get basic numbers: how many people saw your tweet, how many likes, retweets, and a bit of info about your followers. It’s a great start if you’re just dipping your toes and want to understand how your content is received. Relevant for regular users and newbie bloggers.
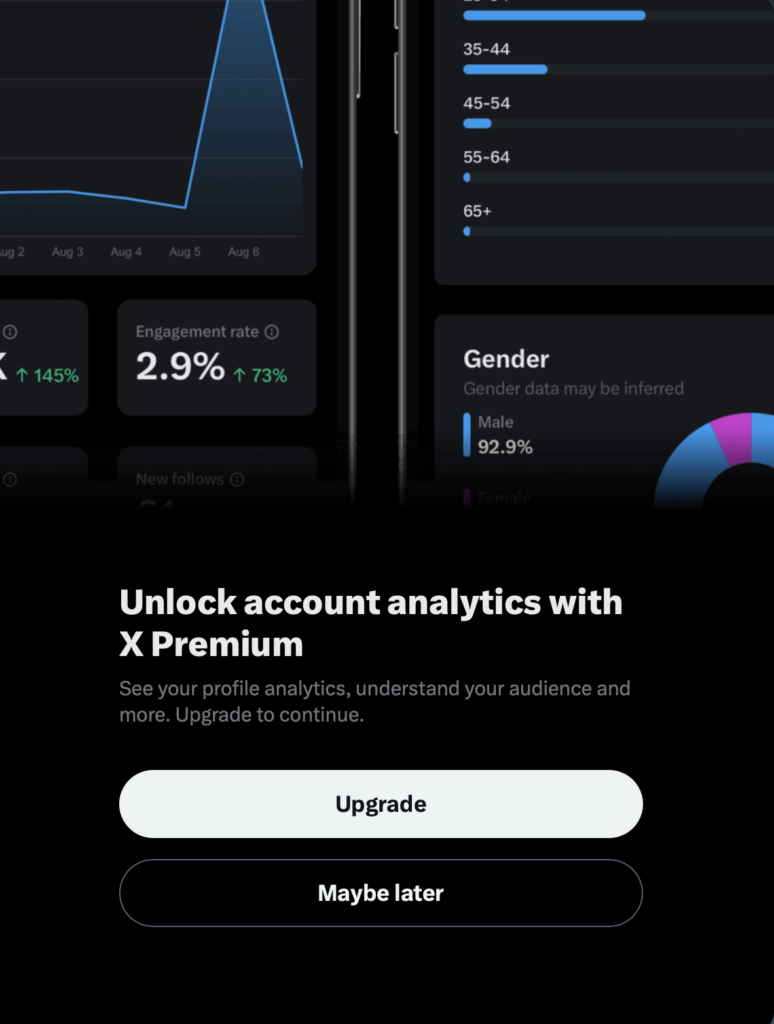
Now, things get juicy. Advanced twitter analytics, available through paid features like Twitter Ads, offers deep data on conversions, detailed campaign analysis, and a complete audience profile. This is essential for SMM professionals and business accounts seriously into marketing and advertising on X.
Imagine you’re launching an ad campaign to promote a new product. With advanced twitter analytics, you can precisely see how many people not only saw your tweet but also clicked through to your website, made a purchase, or performed another target action. This helps you understand how effectively you’re spending your advertising budget and where you might adjust settings for better results.
So, if you need a general overview of activity, standard twitter analytics does the job. But if you’re aiming for deep analysis, optimization of marketing campaigns, and truly detailed Twitter statistics, advanced analytics is the way to go.
It all depends on your goals and how deeply you need to understand audience interactions.
Why Bother with Twitter Analytics?
Social media analytics? Who would’ve thought that a bunch of numbers and charts could tell you so much about how your followers feel about you! Social media analytics helps decode what’s behind every like, retweet, and comment. Plus, it aids in understanding the nuances of your audience and marketing. But let’s take it step by step.
Understanding Audience Behavior
Imagine being able to predict what your followers love, what they skip, when they’re most active, what content really keeps them hooked… Social media analytics makes this absolutely possible!
You analyze patterns and trends in the interactions on your posts and get a clear picture of your audience’s preferences and behaviors. Such a strategic insight!
Data activation then turns those insights into actionable strategies that drive engagement and real results.
Furthermore, social media analytics can segment your audience into different demographics and interest groups. Maybe you have a strong following among young adults from urban areas, or perhaps your brand resonates more with women over 50.
Well, only if you understand these segments, can you create messages or offers for these specific groups.
Solutions such as Salesforce AI orchestrator can help automate segmentation and deliver personalized content at scale.
And as soon as your content feels more relevant, you’ll notice the difference right away!
Social media analytics provides feedback on the performance of your posts and campaigns. And you’re in a continuous feedback loop. So you can quickly pivot away from less effective tactics without wasting time and resources.
Now that you know what your followers like, you can stay one step ahead.
Improving Content Strategy Through Detailed Analysis
A thorough analysis of publication times and their impact on engagement can drastically change your content plan. For example, finding out that tweets posted at 8 PM local time receive 30% more retweets than those posted in the morning hours can help you optimize publication times to improve reach and engagement.
Sure, you could use generic best-time-to-post charts that many people consider.
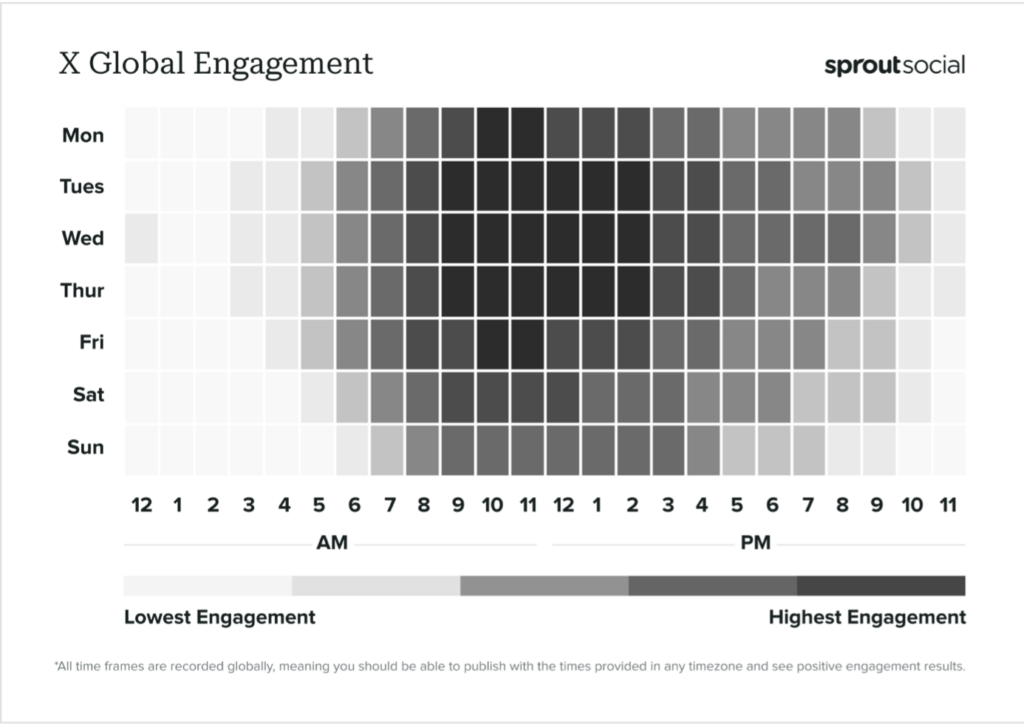
But all this is so imprecise and even a bit amateurish. How do you know that general statistical data will work in your case? Can the same publication time be equally good for followers of an SEO agency from New York, a clothing brand from Poland, or a digital marketing company like Marketing Lad?
We’d recommend gathering your own analytics and relying on that.
Evaluating the Effectiveness of Marketing Campaigns
Launched a campaign? Great! Now let’s see how it’s performing. Every marketing campaign is a big experiment. Analytics is your tool that shows without sugarcoating whether the game is worth the candle or if it’s time to shift tactics. It provides a clear snapshot: what’s driving sales and what’s flying under the radar.
This way, you end up investing in strategies that really deliver.
Making Data-Driven Decisions
Data is power. It simplifies our lives and allows us to make decisions based on hard evidence, not just hunches. No need to speculate and waste budgets on hit-or-miss experiments. Analytics will guide you on where to move next to ensure each step yields results. And if you’re serious about Twitter, trust us, you won’t get far without a solid analytical approach.
Key Metrics of X (Twitter) Analytics
So, if you’re new to twitter analytics, the names of all the metrics might sound like something straight out of a Harry Potter spellbook— Engagus Reachus Expandum! To translate these spells into plain English, let’s see what each one means.
Engagement
Engagement shows how actively people are interacting with your tweets. This includes all the likes, comments, retweets, and link clicks. The bigger these numbers, the more your content’s hitting home with people.
Like, say you spot that your tweets with questions are getting more action. That’s a solid hint that maybe you should throw more questions out there to your followers. Conversely, if you see that your followers completely ignore this type of post and you get zero (or close to zero) engagement, then it’s clear this format isn’t working for you.
Take Sephora, for instance. Questions just don’t work for them and fail to bring in good numbers.

However, posts with memes or even product presentations/posts about sales launches perform really well and show quite impressive engagement levels:

Reach
Reach is basically how many times your tweets pop up on feeds. This doesn’t mean each view is from a different person (someone might see your tweet a couple of times).
This metric helps you figure out how far and wide your content is spreading. If your reach is climbing, that’s a good sign – you’re getting more eyeballs on your tweets.
With twitter analytics, you can also stack up the reach of different campaigns to see which ones knocked it out of the park. For instance, your tweet about a new app update racked up 100,000 impressions, but an earlier one about a new feature only hit 75,000. The numbers tell you that the latest campaign had a wider spread. That’s golden info for marketers. They can sit back and go, “Alright, the second campaign nailed it with a better strategy or a topic that clicked more.” This insight helps them build future campaigns to score even bigger.
Clicks
Clicks indicate how many times users have hit the links in your tweets. This is super important when you’re trying to funnel your audience to your website, blog, or wherever else you want them to go.
Say you drop a link to a new article and it gets a ton of clicks. That means people are really interested in what you’re sharing. Or, if you’ve got a new product and you need to funnel your followers to a sales page, clicks are your bread and butter.
For example, imagine you’re running an ad campaign aimed at increasing sales with promo codes, and you see clicks translating into actual purchases. If the clicks on your links lead to actual purchases, that’s a direct score for your tweet’s impact on your sales figures. Keep an eye on clicks because it’ll let you optimize your call-to-action and zero in on your target audience to crank up conversion rates.
Followers
The number of followers you have is your base. But don’t just watch the number—watch how it changes. If your follower count is growing, that’s a great sign. But if you notice a drop, it’s time to analyze what might not be resonating with your audience. You might need to revisit your post themes or how often you’re publishing.
And here’s a tip: don’t get too hung up on just the number of followers. You’ve probably heard that big numbers can be misleading, and nowhere is that more true than on Twitter. Sure, a large follower count can look impressive and might even boost your ego, but what’s the point if those followers aren’t interacting with your posts? It’s all too common to see an account with tons of followers but little to no engagement.
Minimal reach, hardly any likes or comments—what’s going on?
Often, the reason is that many followers are bots or just inactive accounts. They don’t read your tweets, they don’t like or retweet; they just hang there like dead weight.
This makes it hard to understand the true engagement and interest in your content. The stats might paint one picture, but the reality is different.
We recommend periodically cleaning up your followers and ruthlessly removing bots and inactive accounts. There are various tools for this. But if you don’t have hundreds of thousands of followers, you can simply scan through your follower list, and you’ll immediately spot the bots: they often have random or no profile pictures, and their username is just a string of characters. Spot an account like “ssdyrk0910”? It’s likely a bot, and it’s time to say goodbye to keep your stats clean.
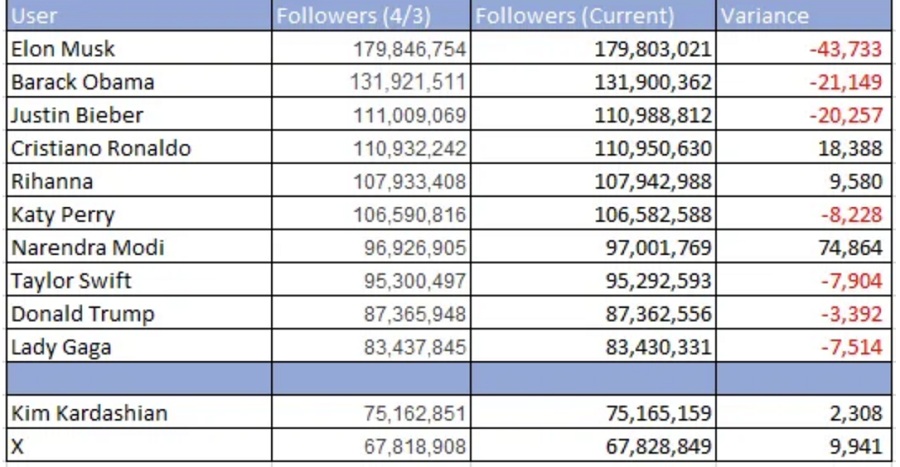
X is on this too, periodically purging bots. You’ll know when they’ve run a clean-up because you might see a slight drop in your followers count overnight. Large accounts can lose up to 5-7% of their followers in these sweeps. Here’s what happened in the latest round for some of Twitter’s superstars:
Retweets and Mentions
Retweets show that people want to share your content with their own followers. This expands your reach. It’s a two-in-one metric! Mentions (when people tag you in tweets) help you understand how often and in what context you/your brand is talked about.
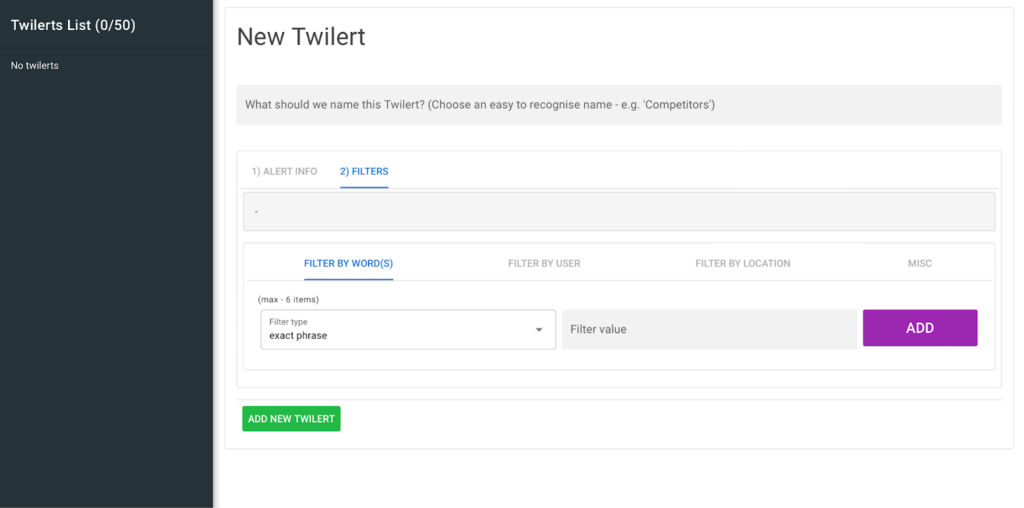
By the way, we like to track mentions not only using Twitter’s analytics but also with an external tool called Twilert. Mentions often require quick reactions, and keeping tabs on stats 24/7 isn’t realistic.
This is all about reputation management. X (Twitter), like some other social networks, is a wonderful platform for crisis management. Here’s how Sephora handles it:

And here’s another example where a user tagged Amazon’s account, and they quickly addressed the issue:

And speed is key here. That’s why Twilert is such a great tool for constant monitoring. It’s like an advanced Twitter search but better, without all the clutter that often comes with vague search results. You set up filters for the information you want, and Twilert sends you all the collected data via email in HTML or plain text. You can set everything up in 5-10 minutes. So, a simple tool can save you from some complex reputation issues.
Hashtag Analysis
Twitter (or X) is basically the ambassador of hashtags on the internet. Everyone recognizes it that way, right?
Hashtags help your tweets get discovered by users searching for information on specific topics. So, the effectiveness of hashtags can be measured by their ability to increase reach and engagement.
A quick tip: Once you find a list of hashtags that really pull in the views, don’t get too carried away. Throwing 5-10 hashtags into one post makes it look more like spam than something people want to retweet or like. In fact, when you pack too many hashtags, your engagement might even take a hit (like a 17% drop). Stick to the sweet spot: 1-3 hashtags per post, just like Twitter suggests.
Challenges and Limitations of Twitter Analytics
X (Twitter) Analytics is indeed a powerful tool, but like everything else, it’s not perfect. It has its limitations. We’ll discuss some of these limitations and also talk about how you can minimize their impact on your strategy.
Data Access Limitations
A big hiccup with X (Twitter) Analytics is the limited time frame for data access. You only get info from the last 28 days with the standard setup. For personal profiles and just keeping an eye on things, that’s usually enough.
However, for SMM professionals, that short window can be a real pain. This is not always enough to analyze trends and plan for the long term. Trying to plan out campaigns months in advance? Good luck doing that with just a glimpse of recent data.
Also, accessing data from very old tweets can be a challenge. If you want to see how reactions to your posts have changed over the year or which campaigns were most successful in the past, you’re out of luck. Know what that feels like? Like you want to watch a movie, and they only play the last 10 minutes before the credits. So, you might find yourself seeking help from third-party tools.
Many marketers export their Twitter analytics data and learn how to import data in salesforce from csv to create comprehensive customer relationship management systems.
Challenges with Metric Interpretation
Interpreting data from X (Twitter) Analytics can be trickier than you might think.
For example, high reach doesn’t always mean a tweet was successful. If a tweet generates a lot of negative reactions and critical retweets, that also increases its reach but doesn’t necessarily benefit your campaign.
Remember how we talked about bots and inactive accounts possibly skewing your stats? For instance, you might see a brand like Stila Cosmetics with tons of followers but surprisingly low engagement.

Why is that? Is it poor content, a bad strategy, or is the data skewed by bots and inactive accounts? See, interpreting metrics is never simple.
These kinds of nuances require careful analysis and an understanding of the context in which the data was gathered. It’s a huge task, and even then, there’s no guarantee it will lead to clear conclusions.
How to Overcome Platform Limitations for X (Twitter) Analytics
There are several ways to enhance your data analysis despite the limitations of Twitter Analytics:
First off, using additional tools is a no-brainer. Third-party services like Hootsuite, Nuelink, Buffer, or Sprout Social offer a broader range of data and user-friendly features for analyzing it. These tools bring in the heavy artillery when you need more in-depth data and high-level analysis.
From that, we get to the second point: exporting data. Twitter Analytics lets you export your data in CSV format, which means you can dig into it with Excel, Google Sheets, or other specialized tools. This opens the door to more in-depth analysis and allows you to compare metrics over longer periods than the platform normally offers.
And here’s a tip that might surprise some: keeping your own database. For understanding long-term trends, it can be really useful to maintain your own data records. You can update them regularly and log key metrics either manually or with automated scripts. It might sound old-school. Well, having your own records can sometimes give you insights that no tool, however advanced, can provide. After all, no one knows your audience like you do.
These approaches require a bit more effort and resources, but with them, platform limitations will be far less of a headache.
Conclusion
Well, here are a couple of final tips: use the metrics to spot which tweets are hitting the mark and which ones aren’t. The hardest task is not collecting information but interpreting it the right way. Don’t be afraid to experiment with different formats and topics. If something isn’t working, switch it up, analyze the data, and keep moving forward.
And remember: real engagement with real people is always better than chasing numbers.

